[Leonard Murphy, Editor-in-Chief of the Green Book provides a view of new research techniques being adopted. I believe the RIGHT research methodology is one tailored to the needs of the client and situation. At BRG, every design is customized in that fashion.]
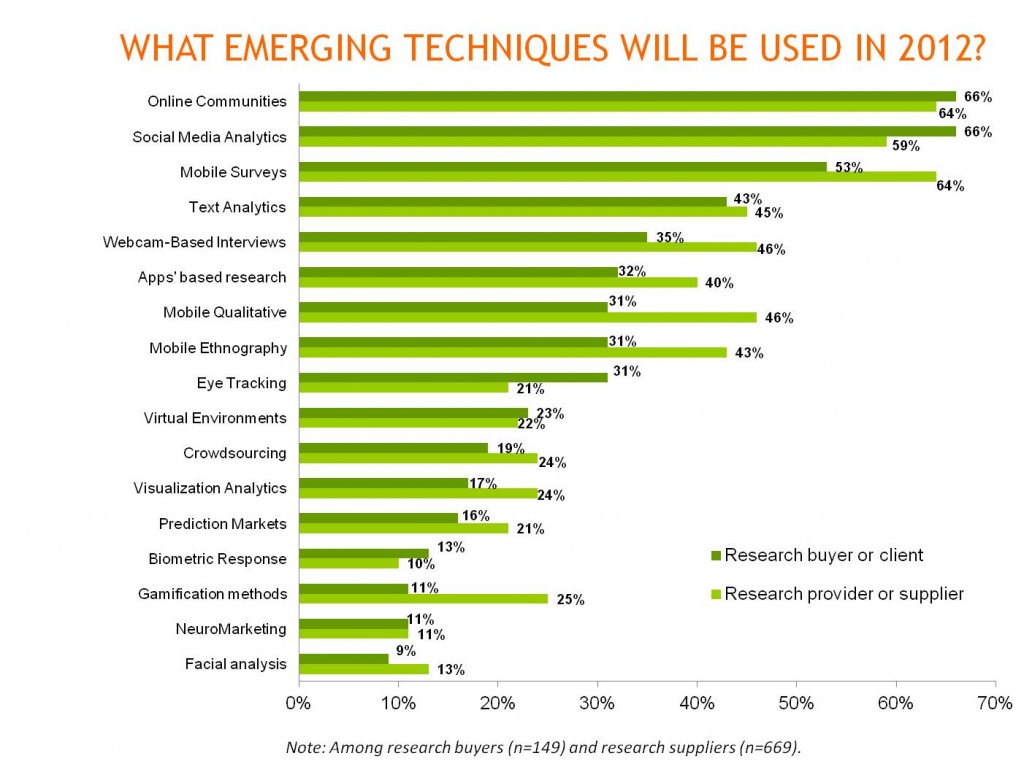
The figures for what companies plan to use/provide in 2012 are approximately twice as high as the figures for what is being done at the moment. This is likely to be a combination of the growth in these techniques and also the power of optimism.

The New Mainstream
About two-third of companies expect to be using online communities and Social Media Analytics in 2012, this supports the view that Online Communities are now mainstream and that Social Media Analytics is becoming mainstream.
Will Mobile Reach the Tipping Point?
A big climber, from actual 2011 to expected 2012, is Mobile Surveys, with buyers jumping from a current 17% to an expected 53% and vendors expecting the increase to be from 24% to 64%. Does this mean that Mobile Surveys are about to take off?
If the figures in this report relate to the estimated 10% of regular online surveys that are being completed on mobile devices this might prove to be true. If the figures relate to specifically designed and fielded mobile surveys the outcome might be different.
One interesting anecdote that might shed light on this issue is that in a recent conversation with a senior leader at a global research provider they stated that within their organizations they billed well into the $100M range for mobile-based projects last year, although due to accounting system issues most of these projects were assigned to CAWI or CAPI codes. They were of the opinion that many large full service firms were struggling with issues like this and that the actual usage of mobile as a research platform was being underreported. Considering that many of the firms that are providing mobile research services are technology providers or sample companies, as well as the newer companies emerging into the space that are not members of any trade organizations that track revenue by method, it is highly likely that mobile research as a contributor of global market research spend is far higher than previously reported.
In the GRIT study we have chosen to focus on modality use as a share of projects rather than revenue and this may explain why GRIT is showing relatively high usage as a discrete mode but other industry studies are reporting far lower indicators.
It is also possible that this issue may impact other emerging techniques such as social media and text analytics as being underreported while actual usage and contribution to revenue is significantly higher.
If this suspicion is true, it supports the bullish attitude that GRIT respondents have towards the growth of mobile.
Buyer Pull
The only method showing more buyers than sellers is eye tracking, which mirrors the split in the current figures. Eye Tracking stands out as consistently having a different pattern of supply and demand.
Vendor Push
Approaches that clearly show more vendors than buyers in 2012 are: Mobile Surveys, Webcam based Interviews, Apps based research, Mobile Qual, Mobile Ethnography, Crowdsourcing, Visualization Analytics. Prediction Markets, and Gamification. All of these represent, to an extent vendor push, which is consistent with the drive to create operational and cost efficiencies as key competitive differentiators from suppliers. In other words, vendors remain focused on the “how”, while clients are more interested in the “Why”. . However, the shape of the total market should not hide the fact that specific buyers will also be driving the process by demanding innovation and change.
The Dark Horse and the Wooden Spoons
Text Analytics is fourth in the table of approaches expected to be used in 2012 and is strongly favored by both vendors and buyers, this may be one to watch.
The approaches that look to both buyers and vendors as niches are Biometric Response, Neuromarketing, and Facial Analysis.
Actual Use Versus Buzz Count
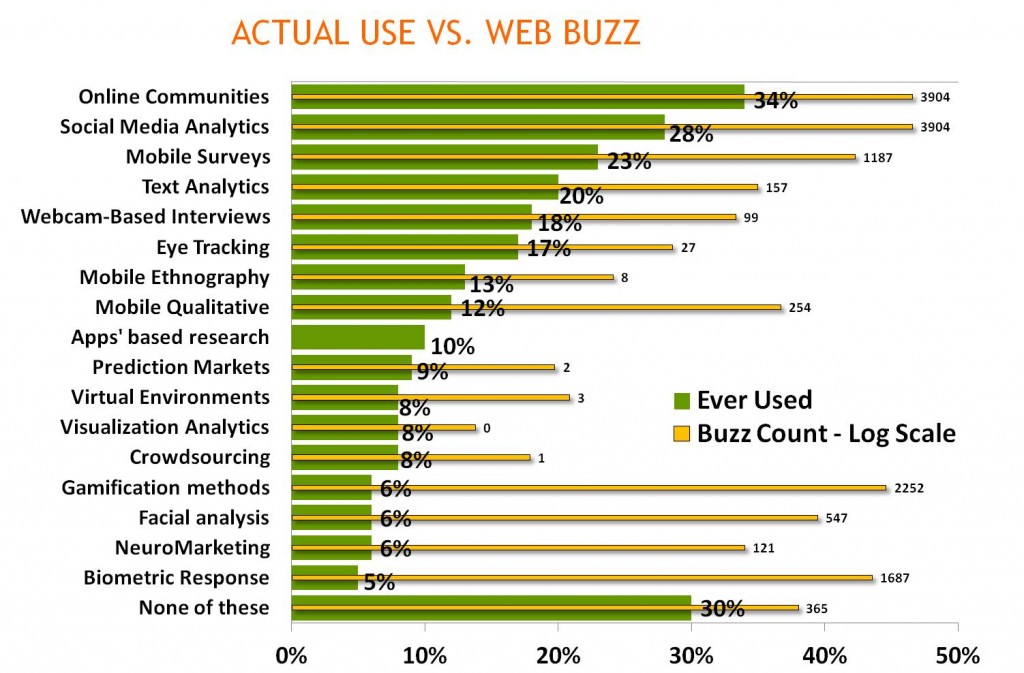
Note the Buzz Count data relates to the previous wave. What the comparison with Buzz and actual use illustrates is that there are two types of relationship between buzz and actual use. For about two-thirds of research approaches the number of organizations saying they use it is broadly correlated with the standardized measurement of buzz. Online Communities and Social Media Analytics are at the top, and items like Virtual Environments and Visualization Analytics are at the bottom.
But there is a small group of approaches where the buzz greatly exceeds the ‘ever use’ figures. For example, Biometirc Response, Neuromarketing, Facial Analysis, and Gamification all have much more buzz than their usage figures would have predicted. This pattern may imply they are about to become popular, or simply reflect that some topics that are widely talked about are just fashionable niches, or that the buzz may reflect that these topics transcend market research and are picking up buzz from a wider part of the market.

Future Intent vs. Actual Use a Year Later
Suppliers
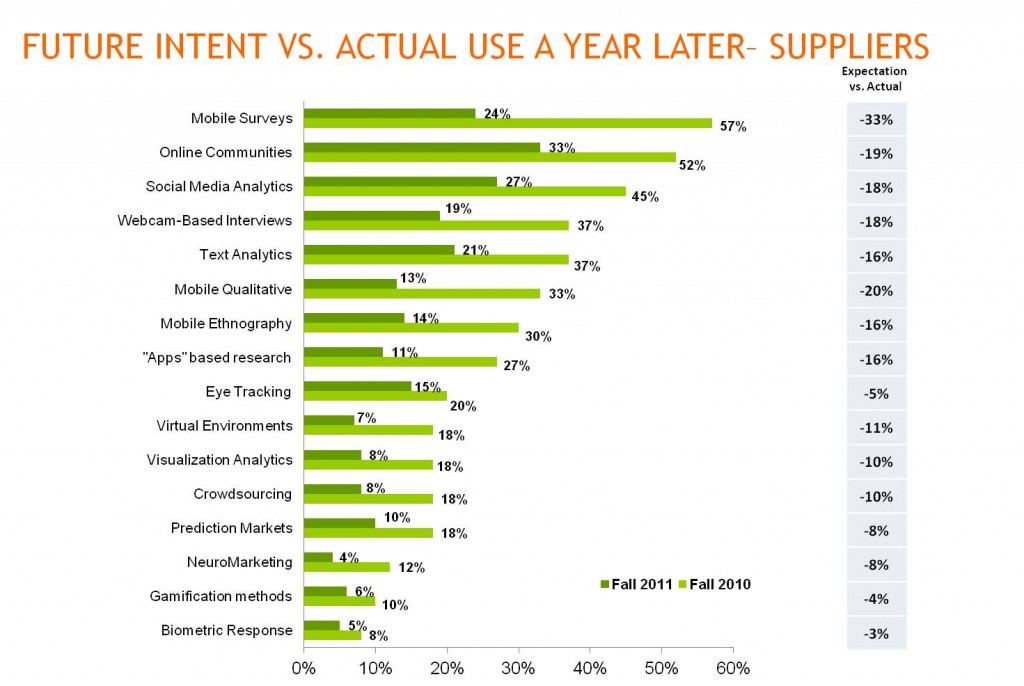
In general market researchers were an optimistic lot in Fall 2010. The actual usage figures in Fall 2011 were about 50% of the figures ‘expected’ in Fall 2010. One difference stands out above all others and that is mobile surveys. In Fall 2010 the forecast was for 57% of companies to use it and the actual usage figure in Fall 2011 was 24%.

Considering that mobile seems to be a supplier “push” method, this perhaps indicates the overestimation of client demand, although it may also be a reflection of the challenges of migrating existing projects such as trackers to the new mode due to design and platform issues. Of course, as previously reported at least anecdotally it may be that that apparent over inflation is not that at all but simply an accurate projection based on business realities “on the ground”. If in fact we are seeing the tipping point in 2012, it has been suggested that new projects, particularly in emerging markets where mobile is the dominant means of consumer contact, will drive adoption. The GRIT sample was not asked those questions, so we’ll be exploring that in subsequent iterations.
The next group of four that undershot their estimates by 18 to 20 percentage points were: Mobile Qual, Online Communities, Social Media Analysis, and Webcam bases Interviews.
Buyers
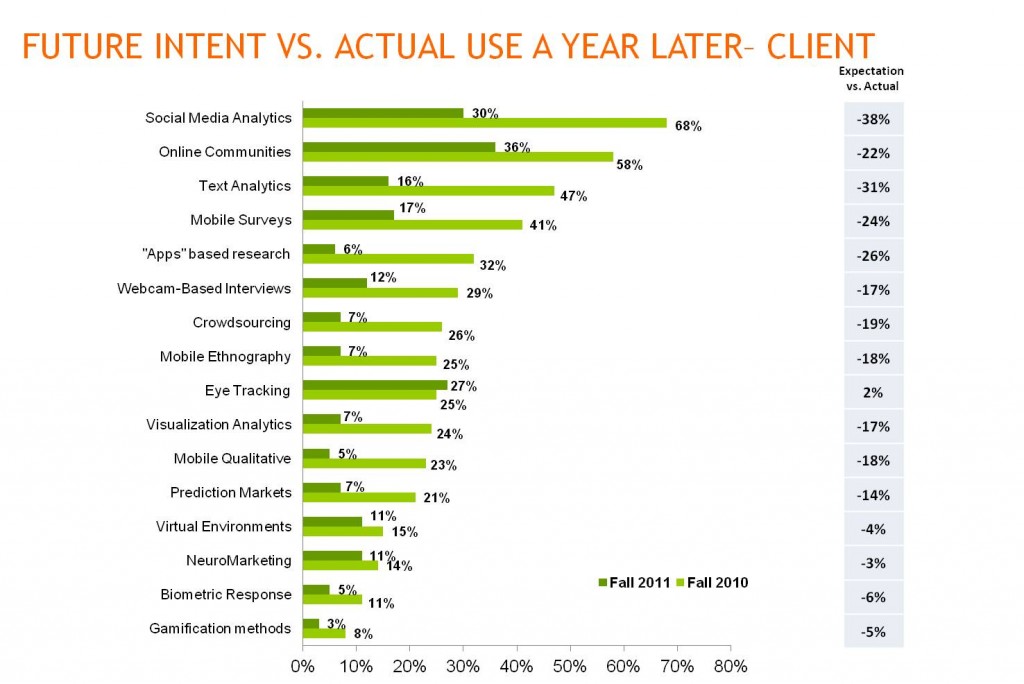
Buyers were even more optimistic in Fall 2010, with the average actual only being 45% of the forecast. The biggest gaps were Social Media Analytics (30% instead of 68%), Text Analytics (16% instead of 47%), and Apps Based Research (6% instead of 32%).


 QRCA is a not-for-profit association of consultants involved in the design and implementation of qualitative research — focus groups, in-depth interviews, in-context and observational research, and more.